


The tech and business world has taken a massive hit over the past few years, with layoff notices making headlines almost daily. As an aspiring data analyst, I couldn’t help but wonder what was actually happening behind those numbers. Was it just a few big players inflating the stats, or were smaller startups hurting just as badly? Did raising millions in funding actually protect companies, or did it make no difference at all?
To get some answers, I decided to dig into a global layoffs dataset using PostgreSQL. This project was a hands-on way for me to practice the full analytical process from writing raw DDL scripts and rolling up my sleeves for some messy data cleaning, to running window functions and CTEs to extract meaningful trends.
In this article, I’ll walk you through my thought process, the technical hurdles I ran into while prepping the data, and the core insights hidden in the numbers.
Note: If you want to check out the full SQL script and dataset schema, feel free to explore my GitHub repository.
Project Overview
Dataset Overview
The data for this project was sourced from Alex The Analyst’s / Ahmed Helbawy’s GitHub Repository, which tracks global layoff events. The raw dataset includes key attributes such as company name, location, industry, total workforce impacted (total_laid_off), percentage of the workforce let go (percentage_laid_off), layoff date, company funding stage (stage), country, and total capital raised (funds_raised_millions).
Tech Stack
- PostgreSQL
Short Summary
This project takes a deep dive into the global layoff phenomenon to figure out which sectors and company profiles took the hardest hits. Starting with raw, unformatted data, I handled various cleaning challenges—like fixing misaligned data types and replacing string-based ‘NULL’ values—before moving on to multi-level SQL analysis. The final queries surfaced clear chronological trends, highlighted key geographic and industry hotspots, and explored whether a company’s funding size offered any real protection against severe workforce cuts.
Data Cleaning & Preprocessing
Before jumping into the finding insights part, I had to deal with the reality of working with raw datasets: they’re rarely clean.
When I first imported the CSV into PostgreSQL, most columns were read as loose text (varchar). On top of that, missing values weren’t actual SQL NULLs; they were stored as the literal string ‘NULL’. Running aggregate functions on data like that would either throw errors or return completely misleading numbers, so getting the foundation right was my first priority.
1. Standardizing Data Types & Fixing String-Based NULLs
My first task was converting the raw text columns into their appropriate SQL data types (INTEGER, DECIMAL, and DATE). To avoid type-casting errors, I first updated all literal ‘NULL’ strings into true database NULL values before running ALTER TABLE statements.
-- Converting percentage_laid_off from varchar to decimal
UPDATE layoffs
SET percentage_laid_off = NULL
WHERE percentage_laid_off = 'NULL';

ALTER TABLE layoffs
ALTER COLUMN percentage_laid_off
TYPE DECIMAL(5, 2)
USING percentage_laid_off::DECIMAL(5, 2);2. Standardizing Categorical Values & Filling Missing Data
Categorical columns had their own quirks. For instance, the industry column had duplicate variations like ‘Crypto Currency’ and ‘CryptoCurrency’. I standardized these into a single ‘Crypto’ category to ensure accurate grouping later on.
Additionally, a few well-known companies had missing industry fields. Using contextual research, I populated missing values for companies like Airbnb (Travel) and Juul (Consumer) so they wouldn’t be excluded from industry-level aggregations.
-- Standardizing industry categories
UPDATE layoffs
SET industry = CASE
    WHEN id IN (1259, 1273, 902) THEN 'Crypto'
    ELSE industry
END
WHERE id IN (1259, 1273, 902);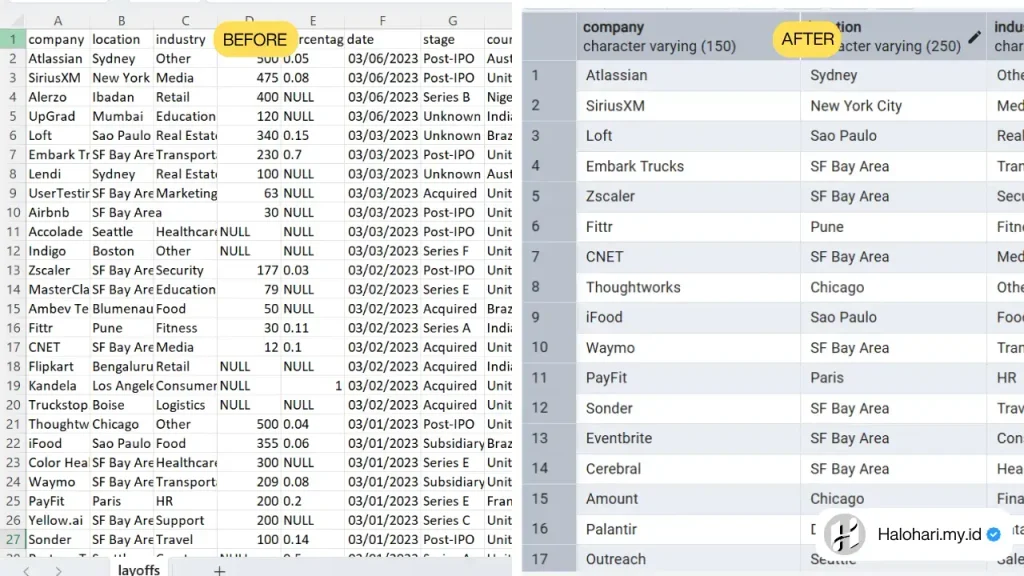
Exploratory Data Analysis & Insights
Once the data was cleaned and structured, I started digging into the patterns behind the numbers. I structured my analysis to move from broad macro-level summaries down to deeper, multi-dimensional queries using Window Functions and CTEs.
1. The Macro Picture: Industries & Geography
To get an immediate sense of scale, I started by aggregating total layoffs by industry and country. The numbers quickly confirmed that workforce reductions weren’t spread evenly, they were heavily concentrated in specific sectors and regions.
-- Ranking top industries by total layoffs
select industry, sum(total_laid_off) as jumlah_phk
from layoffs
group by industry
having sum(total_laid_off) is not null
order by jumlah_phk desc;Tech, Retail, and Consumer sectors took the hardest hits. Geographically, the United States accounted for the lion’s share of total job cuts, though major tech hubs across Europe and Asia also experienced significant secondary waves.
2. Timeline & Accumulation: The Layoff Spikes
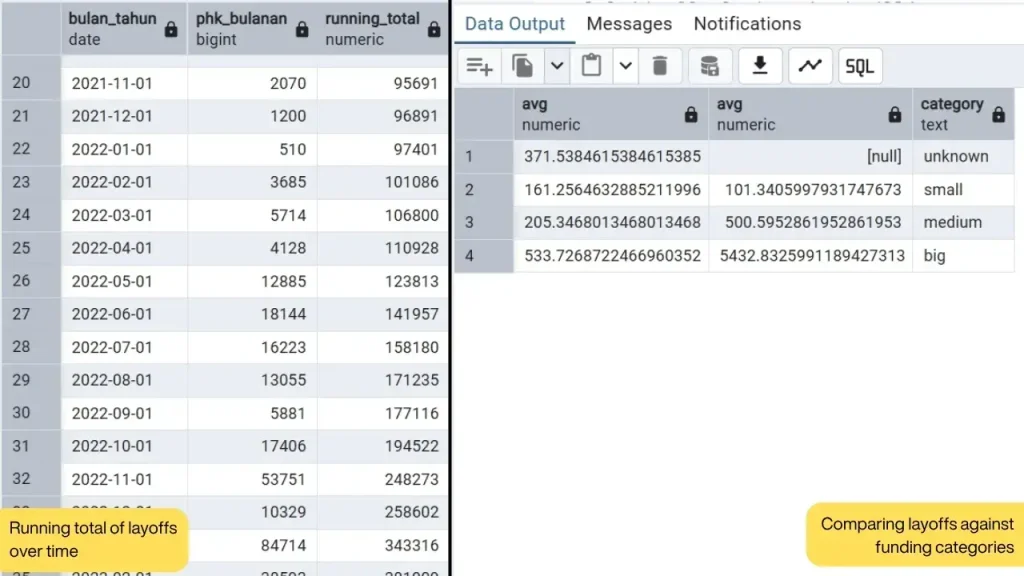
Looking at static totals only tells half the story. To understand when the pressure peaked, I used a Window Function to track the cumulative running total of layoffs across time.
-- Running total of layoffs over time
select
    date_trunc('month', date_laid_off)::date as bulan_tahun,
    sum(total_laid_off) as phk_bulanan,
    sum(sum(total_laid_off)) over(order by date_trunc('month', date_laid_off)) as running_total
from layoffs
where total_laid_off is not null and date_laid_off is not null
group by date_trunc('month', date_laid_off)
order by bulan_tahun;The trend showed that layoffs weren’t a steady stream—they came in sudden, aggressive spikes that correlated with post-pandemic market corrections and rising interest rates.
3. Deep Dive: Did Big Funding Protect Companies?
One of my main questions was whether massive venture capital backing shielded companies during downturns. To test this, I categorized firms by their total capital raised and evaluated how hard they were hit.
-- Comparing layoffs against funding categories
with kategori as (select
total_laid_off, funds_raised_millions,
case
when funds_raised_millions between 0 and 300 then 'small'
when funds_raised_millions between 301 and 800 then 'medium'
when funds_raised_millions > 800 then 'big'
else 'unknown'
end as category
from layoffs)
select avg(total_laid_off), avg(funds_raised_millions), category
from kategori
where total_laid_off is not null
group by category
order by category desc;Counterintuitively, well-funded companies recorded significantly larger average layoff events. Raising hundreds of millions in capital didn’t grant immunity—it often meant companies had over-expanded during boom periods, leading to larger structural cuts when the market cooled down.
Key Insights
- Industry: Tech, Retail, and Consumer sectors absorbed the highest volume of workforce reductions globally.
- Stability: Raising massive capital (>$500M) did not shield companies from layoffs; well-funded firms actually recorded the largest single-event workforce cuts.
- Concentration: The US accounted for the vast majority of total global layoffs, though secondary clusters emerged across major tech hubs in Europe and Asia.
- Timeline: Layoff events weren’t spread evenly over time—they surged in distinct waves, reflecting broader macroeconomic downturns and post-expansion pullbacks.
Challenges & What I Learned
- Cleaning Unstructured Strings: Handling string-based ‘NULL’ values and converting mixed text into proper DATE and NUMERIC types required careful validation before running aggregate queries.
- Data Imputation Trade-offs: Deciding how to fill missing industry values taught me the balance between business context assumptions and maintaining raw data integrity.
- SQL Query Optimization: Building window functions and multi-stage CTEs reinforced how crucial efficient indexing and clean script structuring are when running complex analysis.
- Writing Production-Safe Updates: Hardcoding row IDs for data updates exposed the risks of brittle logic, highlighting the need for dynamic conditional logic (LIKE, subqueries, or joins) in larger datasets.
Changelog
V1.0 – First release (21 Sept 2026)
- Created a project and article